

If you’re an avid Google Analytics user, or even if you just check in once a month to look at key reports, you may have already created a dashboard within Google Analytics so you can see all your key reports in one place. Dashboards provide a great, time-saving way to see the information that’s important to you without having to navigate your way around the myriad of reporting options each time you want to see your data.
Dashboards are well worth setting up for those of you who rarely check in on your Google Analytics too as you can schedule the dashboard to be sent to you via email each week or month, meaning you don’t have to remember to log in and look at your reports.
You can also create different dashboards for different members of your team, so, for example you might create a dashboard for your marketing team showing source and medium reports and goal conversions and ecommerce data so they can track which marketing campaigns are more effective. You could create a dashboard for your web development team showing page speed scores, device and browser usage and goal funnels so they can address any issues with how the website functions. You could also create a dashboard for the directors and senior managers who just want to see revenue vs. ad spend and conversion rates by channel.
Dashboards are great, however, they have their limitations, so enter Google Data Studio…
I’ll be honest, it’s a more advanced tool than using Dashboards and it comes with quite a steep learning curve, but once you’re set up and have your acounts linked, it starts to offer a more flexible approach to creating dashboards.
Benefits of Google Data Studio
Not just for Google Analytics
Google Data Studio allows you to connect other data sources and display these in your reports. For example, data from Google Ads, YouTube, Search Console, Google Sheets and pretty much every other Google owned property.
Not just for Google Products
There’s also Community Connectors which are third party tools that allow you to connect non-Google properties such as Facebook Ads, Twitter Ads, ActiveCampaign, Adobe Analytics, AdRoll, Microsoft Ads, Amazon MWS, Asana, LinkedIn Ads, plus hundreds more. Whilst these third party connectors often come with a price tag attached, just imagine having all your data in one place and the time it will save you!
Visually appealing reports
Ok, you might be thinking that it’s not important what your data looks like, as long as the numbers are there. But creating reports that look visually appealing means your audience will be more likely to read them. Google Data Studio gives you endless options to display your data in different formats, adding shapes, changing colours and fonts and adding branding to your reports. No more charts getting cut in half when exporting as PDF from Analytics!
Shareable reports
Reports can be downloaded and shared manually via email, or you can share a link to your reports so others can log in and view the data themselves. If you have a team who need access to the reports, no problem! You can collaborate in real-time as you would any file in Google Sheets, Google Docs, etc.
Report templates
If starting out with a blank report canvas is a little daunting, there are many templates you can use to get you started. Elements can be added, moved or deleted to fit exactly what you need.
It’s free
Yes, as with most Google products, it’s completely free to get started building dashboards for your data. What’s not to like?
Getting Started with Google Data Studio
#1: Log in to Data Studio at datastudio.google.com. Using the same Google login you use for Analytics will make your life easier. Have a look around and get used to finding where your reports and data sources are located. 
#2. Connect your first data source by clicking the +Create button (top left) and selecting Data Source

#3. Create your first report by clicking the +Create button and selecting Report. OR! Start with a Template by browsing the Template Gallery at the top of the page and finding one that’s close to what you’re looking for.

#4. Add a chart, shapes or text boxes using the menu across the top. Change the theme and layout down the right hand side

#5. Customise the data by clicking on a chart and changing the options on the right hand panel

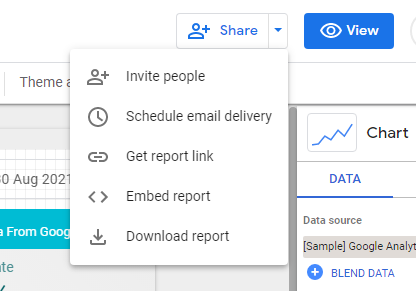
#6. Share the report using the Share button (top right). You’ll see you have different options from inviting others to view the report, scheduling the report to be delivered via email, getting a shareable link to the report, embedding the report in a page or downloading the report as a PDF which you can then attach to an email.
Google Data Studio provides a free way to customise your reports and see data from multiple sources all in one place. It takes a bit of getting used to if you’ve never used it before, but once you have your reports set up, you’ll find it much easier to start experimenting with adding new reports and changing the data in your dashboards. Then all you need to do schedule your report to be created and emailed to you and you’re all set!